| Firearms Production |
1
By Jade Moldae
On the surface, several metrics paint a less-than-rosy picture of the current market facing the U.S. firearms industry.
But, after years of unprecedented growth, the industry’s profile has likewise been enhanced significantly — attracting entirely new customer segments. Yes, the market correction of 2017 rocked the industry (with some companies unable to recover from the sudden plunge in demand) but there are certain hot spots in niche categories thriving today. Adaptable companies have recalibrated their approach, focusing on innovation and gaining business. It isn’t all “doom and gloom” …
Countering the prevailing sentiment today, recent reports reveal the industry has continued to grow — despite the slowdown from peak years.
In April, NSSF published its 2019 Firearms and Ammunition Industry Economic Impact Report, showcasing the industry’s growth — incrementally rising to $52.1 billion in 2018 ($51.4 billion in 2017). Additionally, total jobs associated with the industry also climbed to nearly 312,000. Since 2008, the industry’s economic impact has risen by 171% ($19.1 billion to $52.1 billion).
Southwick Associates’ 2018 Retail Market Size Report further bolsters this case. According to the report, spending in the overall hunting and shooting sports grew 11% in 2018 — totaling $21.3 billion in retail sales. Southwick officials attribute the increase to consumers high-grading their purchases, rather than a surge in volume. The report publicized the average sale increased 20% in 2018 over 2017.
“The data shows what we suspected — the hunting and shooting markets are performing better than recent media coverage indicates,” said Rob Southwick, president of Southwick Associates. “Consumers are not as concerned about firearm restrictions and have shifted toward accessorizing previous years’ purchases and catching up on delayed equipment purchases. The overall market is still strong.”
Further signifying a long-term drive, several firearms manufacturers are in the midst of expansion or relocation endeavors.
In April, CZ-USA announced a two-phase plan to invest $90 million to locate its North American headquarters at the Port of Little Rock, Ark. — the latest company to make a significant investment in a Southern state. CZ-USA’s new headquarters and manufacturing facility will create 565 jobs over the next six years, with the initial startup planned for March 2020.
Currently underway, Taurus USA’s relocation to Bainbridge, Ga., will bring all of its operations into one location. The 200,000-square-foot manufacturing center and corporate headquarters will create 300 new jobs.
Following its Jan. 2018 announcement to relocate operations from California to Wyoming, Weatherby Inc. established its Wyoming residency earlier this year and held a grand opening June 13 at its new Sheridan headquarters. This event attracted 5,000 attendees, according to company officials.
Earlier in 2019, Magnum Research reported the full USA production of all Desert Eagle pistols — concluding a decade-long effort to bring this to fruition.
Since Ruger and American Outdoor Brands Corp. (AOBC) are both publicly traded companies — along with their status as the two largest firearms manufacturers in the U.S. — their performance serves as an important indicator on the state of the U.S. firearms industry.
May 7, Ruger reported its Q1 2019 net sales totaled $114 million, down 13.1% from the corresponding 2018 quarter ($131.2 million).
During a May 8 earnings conference call, Ruger President and CEO Chris Killoy acknowledged the challenging market but provided some prospective on the industry’s progression from 1991 to 2017.
“Over the long term this market has demonstrated very solid growth,” he said. “But along the way, the ride hasn’t always been smooth. We’ve experienced numerous political changes at the federal, state and local levels throughout this period [1991–2017]. There have been 16 year-over-year up years and 10 year-over-year down years. So it’s not always smooth sailing.”
Sales of new products — including the Pistol Caliber Carbine, EC9s pistol, Security-9 pistol and Precision Rimfire Rifle — represented $20.9 million (20%) of Ruger’s firearm sales in Q1 2019. During the earnings call, Killoy shared the company had introduced 44 new products covering 60 different models since the start of 2018.
Being an early adopter of the new Winchester .350 Legend cartridge — with three rifles introduced in April — is illustrative of Ruger’s adaptability, according to Killoy.
“Another key strength of ours is speed to market,” he said. “We’re the first major firearms manufacturer to launch rifles in this new cartridge … again another key differentiator for our company as we navigate tough markets.”
June 19, AOBC announced its Q4 2019 and full year fiscal 2019 financial results. For Q4 2019, AOBC reported net sales of $175.7 million, compared to $172 million over the corresponding 2018 quarter — a 2.2% increase. Full year net sales were $638.3 million, up 5.2% over 2018 sales ($606.9 million).
“Fiscal 2019 was a year that presented challenges for the firearms industry, including changes in the political environment and reduced consumer demand for firearms and the accessories that are attached to them, such as lights, lasers and scopes. Despite that backdrop, we delivered year-over-year growth in revenue and gross margin, and we believe we gained market share,” said James Debney, AOBC president and CEO.
The company’s firearms segment sales grew 6.3% over the prior fiscal year — buoyed by 106 new firearm SKUs, including 32 “meaningful” new products and several line extensions. The S&W Shield achieved a noteworthy milestone during this period, according to Debney.
“Our Shield family of products has become a consumer favorite, and by the end of fiscal 2019 we had shipped over 3 million Shield pistols. We’re now approaching the $1 billion milestone for cumulative sales of the Shield family of handguns,” he said.
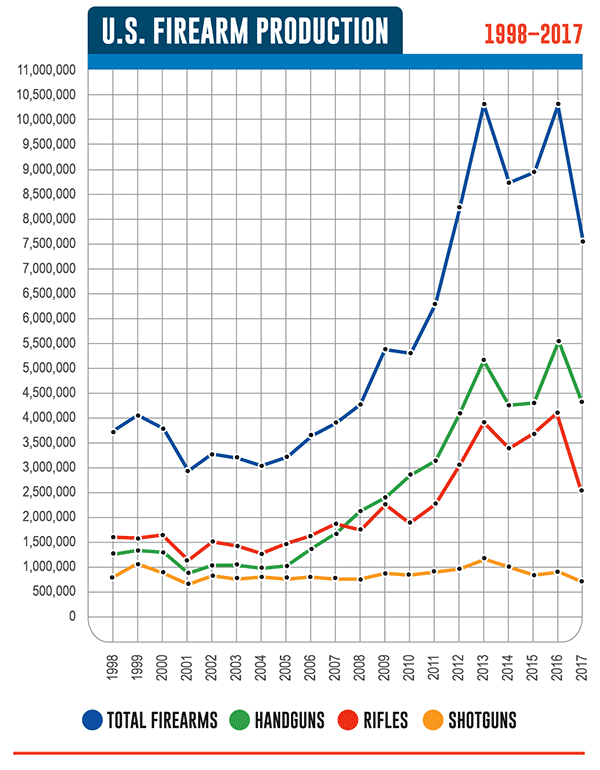
Since 2004, total U.S. firearms production has posted a year-over-year (YOY) increase 10 times. Even in the midst of the Great Recession, the industry continued to thrive — being labeled a “golden era” for the firearms industry in Shooting Industry’s coverage of 2010 production numbers inside the July 2012 issue.
The drop-off from 2016’s unprecedented firearms production was inevitable after President Trump’s surprise victory and a Republican-controlled Congress. A near-decade of elevated fear-induced buying was replaced by an immediate “correction” in the market, with a surplus of products in the retail and wholesale channels ultimately leading to a turbulent business climate in 2017.
ATF’s 2017 Annual Firearms Manufacturing and Export report — the latest data available — reveals a stark decrease in domestic firearms production hit every major firearms segment. U.S. firearms production totaled 7,569,158 in 2017, representing a 29% drop from a record 10,664,318 in 2016. The 29% YOY decrease in 2017 production also marked the most dramatic on record. (Not coincidental, the last time the industry faced a YOY contraction above 20% was in 2001 — the year after Republican George W. Bush was elected president [-22.6%].)
Correlating with the significant drop in U.S. firearms production, NSSF-adjusted NICS background checks likewise experienced a downward trend (falling 11%) in 2017.
Despite being the sixth-highest total on record, 2017’s production was the industry’s lowest since 2011 — when 6,351,479 firearms were produced (also before 2017, 2011 was the last time less than 8 million firearms were manufactured domestically).
Handgun production fell by 20.9%, from a record 5,576,366 to 4,411,927 total handguns. When compared to 2015 production (4,442,458), the third-most prolific year on record for handguns, the decrease is negligible (-0.7%).
The rifle category was the hardest-hit segment in 2017, with a dramatic 40.9% drop compared to 2016 when rifle production broke the 4-million barrier (4,239,335). The steep drop-off of more than 1.7 million rifles continues to affect manufacturers, wholesalers and dealers today. For a historical perspective, 2017’s rifle total of 2,504,092 was the lowest recorded since 2011 (2,318,088).
There were also fewer shotguns made in 2017, down 23% from 2016 (848,617 to 653,139). This marked the lowest shotgun total since 2008 (630,710).
New to this year’s report are the figures for U.S. production of miscellaneous firearms. Per the ATF: “Examples of misc. firearms include pistol grip firearms, starter guns and firearm frames and receivers.” Like other categories in 2017, misc. firearm production experienced a decline: 758,634 from 833,123 in 2016, down 8.9%. (While not factored in any other metrics in this report, the misc. firearms category provides one more barometer of the overall health of the industry.)
Ruger produced 1,614,898 firearms in 2017, replacing Smith & Wesson as the largest firearms manufacturer in the U.S. (Ruger has been the U.S.’ largest firearms manufacturer in nine of the last 10 years recorded.) The company’s total YOY production fell 18.5% from 2016 (1,981,590). Ruger’s 661,155 rifles ensured it was the top rifle manufacturer in 2017 — a first for the company since 2009, when it produced 360,005 rifles. Ruger was also the second-largest handgun maker with 953,727 produced.
Smith & Wesson’s total output dropped 29% in 2017, from its company record 2,120,910 firearms in 2016 to 1,505,211. For the fourth year in a row, S&W was the most prolific handgun maker, which totaled 1,239,834 handguns.
The third-largest firearms manufacturer was Remington, which produced 777,485 firearms — a 37.3% decline from 2016 (1,240,665).
With 572,694 firearms in 2017, SIG SAUER was the fourth-largest U.S. firearms manufacturer. Its 2017 total represented a 9.6% drop from 2016 (633,533). However, the company’s 9mm production posted an increase over 2016 — rising 6.4% (from 346,347 to 368,386).
Rounding out the top five largest U.S. firearms manufacturers, O.F. Mossberg & Sons/Maverick Arms’ output reached 391,401 firearms in 2017 (-23%). The company’s mark of 302,830 shotguns secured its place as the largest shotgun producer in the U.S., a position it also held in 2015.
From this year’s top 25 U.S. manufacturers, it’s worth noting there were several companies that posted YOY increases in 2017.
Heritage Mfg. Inc.’s mark of 226,065 revolvers manufactured in 2017 (the only category it’s involved in) represented a noteworthy 13.1% jump over 2016 (199,905). The company was also the leading revolver producer in 2017, topping S&W’s mark of 207,384 — a first, according to our records. All but 914 of Heritage’s revolvers were in .22.
Even though overall revolver production decreased in 2017 (-15.8%), relative new entrants to the category (or making a return, in the case of Colt) experienced substantial increases. Kimber’s production soared from 2,981 to 21,349 revolvers (all in .357), while Colt’s expanded from 943 to 7,342.
Springfield Armory experienced a windfall in its total 2017 production numbers, manufacturing 150,729 firearms (+48.2%) domestically. The company had robust growth in pistol and rifle categories, achieving increases of 13% and 133.4%, respectively.
Multiplying its firearms production by 55.1% in 2017, Kel-Tec’s mark of 150,630 firearms was driven by a sixfold increase in its rifle production (10,003 to 66,235).
International companies continue to make significant investment in their U.S. operations, evidenced by other increases in 2017. Beretta USA’s domestic pistol production expanded by 33.5% (from 43,002 to 57,411), while Walther Arms’ ballooned from 2,119 (all in .380) in 2016 to 43,248 (multiple calibers) in 2017.
Although it didn’t experience a YOY increase in 2017 (-4.4%), Henry remains in a strong position — rising from the ninth to sixth largest manufacturer in 2017. Henry also entered a new market in 2017: producing 6,146 shotguns.
In contrast to domestic production, the industry’s international business posted several notable increases in 2017. Total U.S. exports surged 31.8% over 2017, increasing from 368,707 to 485,968 firearms. Pistol exports, in particular, powered this upward trajectory — jumping 59.8% (172,408 to 275,424 handguns) in 2017.
Both long-gun categories also posted increases in 2017, with rifle and shotgun exports rising 8% and 21.6%, respectively (Rifles: 147,044 to 158,871; Shotguns: 24,668 to 29,997). U.S. revolver exports represented the only category to experience a downturn in 2017, dropping 11.8% from 2016 (24,587 to 21,676).
For the second consecutive year, SIG SAUER was the top U.S. exporter and was a significant contributor to the increase in U.S. exports — with its 179,172 pistol and rifle exports constituting more than a third (36.9%) of the overall total. SIG’s pistol exports have risen dramatically since 2015, experiencing YOY increases of 135.8% in 2016 (31,486 to 74,256), and 138.9% in 2017 (74,256 to 177,414).
After several years with little movement, Remington’s firearms exports rebounded in impressive fashion in 2017. Remington exports totaled 83,605, making it the second-largest U.S. exporter — its highest ranking since 2006. This significant jump in production was aided by the company’s fully operational Southaven, Miss., worldwide distribution center that opened July 2016.
Other top U.S. exporters in 2017 and their percentage of change from 2016 include: Ruger (54,077 [-4.3%]), Smith & Wesson (50,505 [+25%]) and GLOCK (47,861 [-19.5%]).
See page 33 for charts of U.S. firearm exports of pistols, revolvers, rifles and shotguns.
Using the latest data from the U.S. Census Bureau Economic Indicators Division, U.S. import numbers from 2018 are available. Compared to 2017’s total of 4,153,805 imported firearms, U.S. companies imported 4,022,364 during 2018 — a 3.2% drop. While handgun imports decreased by 9.4% in 2018, both rifles and shotguns recorded increases, rising 17.5% and 18.9%, respectively. For the first time since 2013, the U.S. imported more than 500,000 shotguns.
For the fourth year running, Austria was the top importing country — with the U.S. importing 931,941 firearms (-22.5%). Brazil returned as the second-largest importing country, with 861,791 firearms (+13.4%), a position it has held since 2015.
Other top importing countries include: Turkey (368,322 [+15.6%]), Germany (344,986 [-2%]) and Italy (308,622 [+0.24%]). According to our records, 2018 marked the first time Turkey appeared in the top three importing countries.
The industry has endured a difficult ride from the unprecedented heights of 2016. However, savvy companies are taking this opportunity to get more efficient, innovative and perceptive to meet the needs of the market — therefore winning sales. With the 2020 election cycle gathering momentum (the first Democratic presidential primary debate was held in Miami just days after press time), firearms sales will likely be impacted once again as the campaign trail rhetoric heats up.
In the meantime, though, the industry will continue to grind out results in 2019. The rising tide of this past decade ensures the industry will enter this next era with sights set on establishing further growth.
| YEAR | JAN. | FEB | MARCH | APRIL | MAY | JUNE |
| 2015 | 1,052,441 | 1,280,825 | 1,187,823 | 987,698 | 918,707 | 886,825 |
| 2016 | 1,362,847 | 1,487,871 | 1,297,275 | 1,130,238 | 928,532 | 1,140,088 |
| 2017 | 1,038,365 | 1,298,208 | 1,356,929 | 1,111,596 | 988,473 | 1,016,213 |
| 2018 | 955,466 | 1,271,942 | 1,503,967 | 1,065,927 | 904,834 | 892,479 |
| 2019 | 988,160 | 1,109,087 | 1,317,114 | 992,642 | 910,910 | N/A |
| YEAR | JULY | AUG. | SEPT. | OCT. | NOV. | DEC. | TOTALS |
| 2015 | 946,528 | 1,031,959 | 1,071,945 | 1,211,478 | 1,432,451 | 2,235,560 | 14,244,240 |
| 2016 | 1,210,731 | 1,151,679 | 1,156,961 | 1,353,299 | 1,662,338 | 1,845,847 | 15,700,471 |
| 2017 | 907,348 | 1,021,227 | 1,019,037 | 1,132,065 | 1,457,103 | 1,621,261 | 13,967,825 |
| 2018 | 821,260 | 966,809 | 919,979 | 1,005,062 | 1,314,193 | 1,494,087 | 13,116,005 |
| 2019 | N/A | N/A | N/A | N/A | N/A | N/A | 5,317,913 |
NSSF removes NICS purpose code permit checks used by several states for CCW permit application checks and other purposes. The removal of this data provides a more accurate report of background checks conducted for the purchase of firearms. Visit www.nssf.org/research.
| Year | Handguns | Rifles | Shotguns | Total |
| 1998 | 1,284,755 | 1,535,690 | 868,696 | 3,689,084 |
| 1999 | 1,331,230 | 1,569,685 | 1,106,995 | 4,007,910 |
| 2000 | 1,281,861 | 1,583,042 | 898,442 | 3,763,345 |
| 2001 | 946,979 | 1,284,554 | 679,813 | 2,911,346 |
| 2002 | 1,088,584 | 1,515,286 | 741,325 | 3,345,195 |
| 2003 | 1,121,024 | 1,430,324 | 726,078 | 3,277,426 |
| 2004 | 1,022,610 | 1,325,138 | 731,769 | 3,079,517 |
| 2005 | 1,077,630 | 1,431,372 | 709,313 | 3,218,315 |
| 2006 | 1,406,329 | 1,496,505 | 714,618 | 3,614,452 |
| 2007 | 1,610,998 | 1,610,923 | 645,231 | 3,867,152 |
| 2008 | 2,041,134 | 1,734,536 | 630,710 | 4,195,873 |
| 2009 | 2,415,453 | 2,248,851 | 752,699 | 5,417,003 |
| 2010 | 2,817,377 | 1,830,556 | 743,378 | 5,391,311 |
| 2011 | 3,170,990 | 2,318,088 | 862,401 | 6,351,479 |
| 2012 | 4,155,240 | 3,168,206 | 949,010 | 8,269,456 |
| 2013 | 5,167,008 | 3,979,570 | 1,203,072 | 10,349,650 |
| 2014 | 4,377,501 | 3,379,549 | 935,411 | 8,692,461 |
| 2015 | 4,442,458 | 3,691,799 | 777,273 | 8,911,530 |
| 2016 | 5,576,366 | 4,239,335 | 848,617 | 0,664,318 |
| 2017 | 4,411,927 | 2,504,092 | 653,139 | 7,569,158 |
| Total | 50,747,454 | 43,877,101 | 16,177,933 | 110,585,981 |
| MANUFACTURER | PISTOLS | REVOLVERS | RIFLES | SHOTGUNS | TOTAL |
| Sturm, Ruger & Co. Inc. | 781,623 | 172,104 | 661,155 | 16 | 1,614,898 |
| Smith & Wesson Corp. | 1,032,450 | 207,384 | 265,356 | 21 | 1,505,211 |
| Remington Arms Co. | 59,581 | 448,513 | 269,391 | 777,485 | |
| SIG SAUER Inc. | 536,774 | 35,920 | 572,694 | ||
| O.F. Mossberg & Sons Inc./Maverick Arms | 88,571 | 302,830 | 391,401 | ||
| Henry RAC Holding Corp. | 267,214 | 6,146 | 273,360 | ||
| Heritage Mfg. Inc. | 226,065 | 226,065 | |||
| Kimber Mfg. Inc. | 183,858 | 21,349 | 11,378 | 216,585 | |
| GLOCK Inc. | 175,696 | 175,696 | |||
| Springfield Inc. | 81,377 | 69,352 | 150,729 | ||
| SCCY Industries | 150,647 | 150,647 | |||
| Kel-Tec CNC Industries Inc. | 58,982 | 66,235 | 25,413 | 150,630 | |
| Radical Firearms | 2,775 | 88,430 | 91,205 | ||
| Strassell’s Machine Inc. (Hi-Point) | 46,015 | 40,511 | 86,526 | ||
| Beretta USA Corp. | 57,411 | 2,778 | 17,025 | 77,214 | |
| FN America | 61,510 | 15,614 | 77,124 | ||
| Taurus Mfg. Inc. | 69,123 | 103 | 69,226 | ||
| Colt’s Mfg. Co. | 31,987 | 7,342 | 13,942 | 53,271 | |
| Browning Arms Co. | 50,331 | 668 | 453 | 51,452 | |
| Diamondback Firearms | 24,270 | 26,960 | 51,230 | ||
| North American Arms Inc. | 809 | 46,138 | 46,947 | ||
| Walther Arms | 43,248 | 1 | 43,249 | ||
| Daniel Defense Inc. | 513 | 34,098 | 34,611 | ||
| Outdoor Colors | 1,712 | 11,946 | 19,776 | 33,434 | |
| Saeilo Inc. | 23,646 | 8,615 | 32,261 |
Total includes all U.S. manufacturers.
| MANUFACTURER | PISTOLS | REVOLVERS | TOTAL |
| Smith & Wesson Corp. | 1,032,450 | 207,384 | 1,239,834 |
| Sturm, Ruger & Co. Inc. | 781,623 | 172,104 | 953,727 |
| SIG SAUER Inc. | 536,774 | 536,774 | |
| Heritage Mfg. Inc. | 226,065 | 226,065 | |
| Kimber Mfg. Inc. | 183,858 | 21,349 | 205,207 |
| GLOCK Inc. | 175,696 | 175,696 | |
| SCCY Industries | 150,647 | 150,647 | |
| Springfield Inc. | 81,377 | 81,377 | |
| Taurus International Mfg. Inc. | 69,123 | 69,123 | |
| FN America | 61,510 | 61,510 | |
| Remington Arms Co. | 59,581 | 59,581 | |
| Kel-Tec CNC Industries Inc. | 58,982 | 58,982 | |
| Beretta USA Corp. | 57,411 | 57,411 | |
| Browning Arms Co. | 50,331 | 50,331 | |
| North American Arms Inc. | 809 | 46,138 | 46,947 |
| Strassell’s Machine Inc. (Hi-Point) | 46,015 | 46,015 | |
| Walther Arms | 43,248 | 43,248 | |
| Colt’s Mfg. Co. | 31,987 | 7,342 | 39,329 |
| Cobra Enterprises Of Utah Inc. | 27,905 | 27,905 | |
| Jimenez Arms Inc. | 26,499 | 26,499 | |
| Charter Arms | 24,310 | 24,310 | |
| Diamondback Firearms | 24,270 | 24,270 | |
| Saeilo Inc. | 23,646 | 23,646 | |
| Phoenix Arms | 20,650 | 20,650 | |
| Bond Arms Inc. | 13,333 | 13,333 | |
| Haskell Mfg. Inc. | 10,900 | 10,900 | |
| Magnum Research Inc. | 8,367 | 959 | 9,326 |
| Century Arms Inc. | 9,321 | 9,321 | |
| CZ-USA Inc. | 8,261 | 600 | 8,861 |
| Valley Steel Stamp Inc. | 7,890 | 7,890 | |
| Iberia Firearms Inc. | 7,800 | 7,800 | |
| FMK Firearms Inc. | 7,000 | 7,000 | |
| STI International | 6,416 | 6,416 | |
| Frank Roth Co. Inc. | 5,742 | 5,742 | |
| Wilson Combat | 5,203 | 5,203 | |
| American Tactical Inc. | 5,005 | 5,005 | |
| SilencerCo | 4,850 | 4,850 | |
| Alphatech Inc. | 3,450 | 3,450 | |
| Palmetto State Armory | 3,326 | 3,326 | |
| KRISS USA Inc. | 3,254 | 3,254 | |
| VLH Inc. | 3,037 | 3,037 | |
| Radical Firearms | 2,775 | 2,775 | |
| Trailblazer Firearms | 2,723 | 2,723 | |
| Freedom Ordnance Mfg. Inc. | 2,552 | 2,552 | |
| MasterPiece Arms Holding Co. | 2,336 | 2,336 | |
| Honor Defense | 2,327 | 2,327 | |
| Nighthawk Custom | 2,299 | 2,299 | |
| Outdoor Colors | 1,712 | 1,712 | |
| Whalley Precision Inc. | 1,706 | 1,706 | |
| V Custom Inc. | 1,474 | 1,474 | |
| Anderson Mfg. | 1,448 | 1,448 | |
| Les Baer Custom Inc. | 1,382 | 1,382 | |
| Coonan Inc. | 1,345 | 1,345 | |
| Cobray Firearms Of Tennessee | 987 | 987 | |
| Extar | 950 | 950 | |
| CMMG Inc. | 844 | 844 | |
| Ed Brown Products Inc. | 827 | 827 | |
| Hudson Mfg. | 770 | 770 | |
| Bravo Co. Mfg. Inc. | 593 | 593 | |
| Full Conceal Inc. | 542 | 542 | |
| Freedom Arms Inc. | 20 | 498 | |
| Daniel Defense Inc. | 513 | 513 | |
| LWRC International | 492 | 492 | |
| U.S. Armament Corp. | 441 | 441 | |
| Podunk Inc. | 436 | 436 | |
| Del-Ton Inc. | 433 | 433 | |
| Foster Industries Inc. | 405 | 405 | |
| Cabot Gun Co. | 404 | 404 | |
| Heizer Defense | 400 | 400 | |
| Pacific Trading Group | 277 | 122 | 399 |
| Modern Outfitters | 399 | 399 | |
| Keystone Sporting Arms | 395 | 395 | |
| Westside Armory Ltd. | 373 | 15 | 388 |
| Island View Enterprises Inc. | 303 | 34 | 337 |
| Primary Weapons Systems Inc. | 329 | 329 | |
| Windham Weaponry Inc. | 311 | 311 | |
| Rock River Arms Inc. | 301 | 301 | |
| Black Rifle Customs | 295 | 295 | |
| Velocity | 293 | 293 | |
| Top Notch Accessories Inc. | 277 | 277 | |
| Visionary Fabrication | 217 | 46 | 263 |
| Barrett Firearms Mfg. Inc. | 244 | 244 | |
| Standard Mfg. Co. | 231 | 231 | |
| Excel Industries Inc. | 221 | 221 | |
| Angstadt Arms | 214 | 214 | |
| Hardened Arms | 210 | 210 | |
| Christensen Arms | 207 | 207 | |
| ARES Defense Systems Inc. | 200 | 200 | |
| ANTTACTICAL | 198 | 198 | |
| Luxus Arms | 193 | 193 | |
| Strayer Voigt Inc. | 193 | 193 | |
| Meggitt Training Systems Inc. | 185 | 2 | 187 |
| Atlas Gunworks Inc | 171 | 171 | |
| Ptr Industries Inc. | 164 | 164 | |
| Alex Pro Firearms | 160 | 160 | |
| Black Rain Ordnance Inc. | 160 | 160 | |
| Dsktb Group | 146 | 155 | |
| Heckler & Koch Inc. | 140 | 140 | |
| Good Time Outdoors Inc. | 139 | 139 | |
| TNW Firearms Inc. | 138 | 138 | |
| Partisan Enterprises | 116 | 116 | |
| Custom Designed Computers | 109 | 109 | |
| American Derringer Corp. | 104 | 104 | |
| Alien Armory Tactical | 103 | 103 | |
| Total | 3,691,010 | 720,917 | 4,411,927 |
Totals include all U.S. handgun manufacturers.
| Manufacturer | TO .22 | TO .25 | TO .32 | TO .380 | TO 9mm | TO .50 | Total |
| Smith & Wesson Corp. | 61,997 | 3 | 78 | 113,246 | 606,732 | 250,394 | 1,032,450 |
| Sturm, Ruger & Co. Inc. | 196,582 | 376,304 | 163,887 | 44,850 | 781,623 | ||
| SIG SAUER Inc. | 2,229 | 396 | 495 | 66,588 | 368,386 | 98,680 | 536,774 |
| Kimber | 37 | 27,608 | 98,385 | 57,828 | 183,858 | ||
| GLOCK Inc. | 73,646 | 94,665 | 7,385 | 175,696 | |||
| SCCY Industries | 412 | 150,235 | 150,647 | ||||
| Springfield | 23,918 | 57,459 | 81,377 | ||||
| Taurus Mfg. | 8,948 | 3 | 60,172 | 69,123 | |||
| FN America | 45,384 | 16,126 | 61,510 | ||||
| Remington | 35 | 15,178 | 25,781 | 18,587 | 59,581 | ||
| Kel-Tec CNC Industries | 46,696 | 315 | 3,680 | 8,291 | 58,982 | ||
| Beretta USA Corp | 5,432 | 184 | 20,810 | 30,741 | 244 | 57,411 | |
| Browning Arms Co. | 30,859 | 19,472 | 50,331 | ||||
| Strassell’s Machine Inc. (Hi-Point) |
14,805 | 31,210 | 46,015 | ||||
| Walther Arms | 10,856 | 13,604 | 17,688 | 1,100 | 43,248 | ||
| Colt | 1 | 1,613 | 4,396 | 25,977 | 31,987 | ||
| Cobra Enterprises Of Utah Inc. |
3,485 | 11 | 2 | 11,475 | 12,852 | 80 | 27,905 |
| Jimenez Arms Inc. | 5,063 | 435 | 299 | 11,586 | 9,116 | 26,499 | |
| Diamondback Firearms | 4,706 | 777 | 4,115 | 14,672 | 24,270 | ||
| Saeilo Inc. | 100 | 3 | 5,360 | 10,075 | 8,108 | 23,646 | |
| Phonenix Arms | 16,762 | 3,888 | 20,650 | ||||
| Bond Arms Inc. | 143 | 8 | 1,916 | 1,637 | 9,629 | 13,333 | |
| Haskell Mfg. Inc. | 10,900 | 10,900 | |||||
| Century Arms Inc. | 9,321 | 9,321 | |||||
| Magnum Research INc. | 1 | 5 | 501 | 643 | 7,217 | 8,367 | |
| CZ-USA Unc | 2,727 | 5,534 | 8,261 | ||||
| Ibeeria Firearms Inc. | 7,800 | 7,800 | |||||
| FMK FIrearms Inc. | 7,000 | 7,000 | |||||
| STI Firearms | 4,890 | 1,526 | 6,416 | ||||
| Wilson Combat | 3,346 | 1,857 | 5,203 | ||||
| American Tactical Inc. | 833 | 4,172 | 5,005 | ||||
| SilencerCo | 4,850 | 4,850 | |||||
| Alphatech Inc. | 3,450 | 3,450 | |||||
| Palmetto Stage Armory | 1,410 | 624 | 381 | 911 | 3,326 | ||
| KRISS USA Inc. | 1,413 | 1,841 | 3,254 | ||||
| VLH Inc. | 925 | 2,112 | 3,037 | ||||
| Radical Firearms | 1,398 | 1,326 | 51 | 2,775 | |||
| Trailblazer Firearms | 2,723 | 2,723 | |||||
| Freedom Ordnance Mfg. | 2,552 | 2,552 | |||||
| MasterPiece Arms Holding | 2,282 | 54 | 2,336 | ||||
| Honor Defense | 2,327 | 2,327 | |||||
| Nighthawk Custom | 766 | 1,533 | 2,299 | ||||
| Outdoor Colors | 1,712 | 1,712 | |||||
| Whalley Precision Inc. | 86 | 1,035 | 525 | 1,706 | |||
| V Custom Inc. | 1,474 | 1,474 | |||||
| Anderson Mfg. | 1,445 | 3 | 1.448 | ||||
| Les Baer Custom Inc. | 171 | 1,211 | 1,382 | ||||
| Coonan Inc. | 1,345 | 1,345 | |||||
| Cobray Firearms Of Tenn. | 499 | 488 | 987 | ||||
| Extar | 950 | 950 | |||||
| CMMG. Inc | 27 | 105 | 283 | 429 | 844 | ||
| Ed Brown Products Inc. | 103 | 724 | 827 | ||||
| North American Arms Inc. | 50 | 440 | 319 | 809 | |||
| Hudson Mfg. | 770 | 770 | |||||
| Bravo Co. Mfg. Inc. | 593 | 593 | |||||
| Full Conceal Inc. | 542 | 542 | |||||
| Daniel Defense Inc. | 362 | 151 | 513 | ||||
| LWRC International | 471 | 21 | 492 | ||||
| U.S. Armament Corp. | 441 | 441 | |||||
| Podunk Inc. | 245 | 56 | 135 | 436 | |||
| Del-Ton Inc. | 433 | 433 | |||||
| Foster Industries Inc. | 405 | 405 | |||||
| Cabot Gun Co. | 65 | 339 | 404 | ||||
| Heizer Defense | 400 | 400 | |||||
| Total | 408,705 | 11,135 | 8,152 | 848,425 | 1,756,618 | 657,618 | 3,691,010 |
Total includes all U.S. manufacturers.
| MANUFACTURER | TO .22 | TO .32 | TO .357 | TO .38 | TO .44 | TO .50 | TOTAL |
| Heritage Mfg. Inc. | 225,151 | 470 | 444 | 226,065 | |||
| Smith & Wesson Corp. | 7,123 | 43,263 | 116,823 | 15,973 | 24,202 | 207,384 | |
| Sturm, Ruger & Co. Inc. | 34,483 | 967 | 64,711 | 29,817 | 23,585 | 18,541 | 172,104 |
| North American Arms Inc. | 46,138 | 46,138 | |||||
| Charter Arms | 4,935 | 589 | 3,388 | 12,149 | 2,197 | 1,052 | 24,310 |
| Kimber Mfg. Inc. | 21,349 | 21,349 | |||||
| Valley Steel Stamp Inc. | 7,890 | 7,890 | |||||
| Colt’s Mfg. Co. | 1 | 14 | 50 | 6,785 | 55 | 457 | 7,342 |
| Frank Roth Co. Inc. | 1,388 | 4,354 | 5,742 | ||||
| Magnum Research Inc. | 112 | 59 | 788 | 959 | |||
| CZ-USA Inc. | 600 | 600 | |||||
| Freedom Arms Inc. | 57 | 26 | 75 | 124 | 216 | 498 | |
| Pacific Trading Group | 23 | 1 | 28 | 35 | 35 | 122 | |
| Harpers Ferry Armory | 58 | 23 | 81 | ||||
| Visionary Fabrication | 9 | 1 | 9 | 20 | 6 | 1 | 46 |
| Island View Enterprises | 5 | 9 | 19 | 1 | 34 | ||
| BC Engineering | 20 | 20 | |||||
| Arrowhead Sporting | 19 | 19 | |||||
| Voight, John Basil | 4 | 6 | 4 | 4 | 18 | ||
| TAC 47 Industries | 3 | 8 | 4 | 2 | 17 | ||
| Gemini Customs | 8 | 7 | 15 | ||||
| Westside Armory Ltd. | 4 | 8 | 3 | 15 | |||
| Wild West Guns | 13 | 13 | |||||
| Fiddler’s Green | 10 | 10 | |||||
| Crosshair Customs | 4 | 3 | 2 | 9 | |||
| Total | 319,364 | 1,715 | 134,053 | 177,956 | 42,062 | 45,767 | 720,917 |
Total includes all U.S. manufacturers.
| MANUFACTURER | RIFLES | SHOTGUNS | TOTAL |
| Remington Arms Co. | 448,513 | 269,391 | 717,904 |
| Sturm, Ruger & Co. | 661,155 | 16 | 661,171 |
| O.F. Mossberg & Sons Inc./ Maverick Arms |
88,571 | 302,830 | 391,401 |
| Henry Rac Holding Corp. | 267,214 | 6,146 | 273,360 |
| Smith & Wesson Corp. | 265,356 | 21 | 265,377 |
| Kel-Tec CNC Industries Inc. | 66,235 | 25,413 | 91,648 |
| Radical Firearms | 88,430 | 88,430 | |
| Springfield Inc. | 69,352 | 69,352 | |
| Strassell’s Machine Inc. (Hi-Point) | 40,511 | 40,511 | |
| SIG SAUER Inc. | 64,715 | 35,920 | |
| Daniel Defense Inc. | 34,098 | 34,098 | |
| Outdoor Colors | 11,946 | 19,776 | 31,722 |
| RP Abrasives & Machine Inc. | 28,982 | 28,982 | |
| Palmetto State Armory | 28,562 | 28,562 | |
| Diamondback Firearms | 26,960 | 26,960 | |
| Del-Ton Inc. | 24,829 | 49,159 | |
| American Tactical Inc. | 20,898 | 1,432 | 22,330 |
| Century Arms Inc. | 19,888 | 19,888 | |
| Beretta USA Corp. | 2,778 | 17,025 | 19,803 |
| FN America | 15,614 | 15,614 | |
| IWI U.S. Inc. | 14,133 | 14,133 | |
| Colt’s Mfg. Co. | 13,942 | 13,942 | |
| LWRC International | 12,413 | 3 | 12,416 |
| Kimber Mfg. Inc. | 11,378 | 11,378 | |
| Stag Arms | 10,932 | 10,932 | |
| Windham Weaponry Inc. | 9,484 | 9,484 | |
| Christensen Arms | 8,992 | 8,992 | |
| Strategic Armory Corp. | 8,835 | 8,835 | |
| Saeilo Inc. | 12,768 | 8,615 | |
| IO Inc. | 7,460 | 7,460 | |
| Rock River Arms Inc. | 6,667 | 6,667 | |
| Bravo Co. Mfg. Inc. | 6,467 | 6,467 | |
| Patriot Ordnance Factory Inc. | 5,079 | 5,079 | |
| Barrett Firearms Mfg. Inc. | 4,749 | 293 | 5,042 |
| Weatherby Inc. | 3,937 | 3,937 | |
| KRISS USA Inc. | 3,660 | 3,660 | |
| Areotek Industries | 3,587 | 3,587 | |
| Standard Mfg. Co. | 160 | 3,131 | 3,291 |
| Tactical Solutions Inc. | 3,247 | 3,247 | |
| Bear Creek Arsenal | 3,023 | 3,023 | |
| FIME Group | 2,190 | 579 | 2,769 |
| Troy Industries Inc. | 2,688 | 2,688 | |
| Freedom Ordnance Mfg. Inc. | 2,498 | 2,498 | |
| Just Right Carbines | 2,444 | 2,444 | |
| CMMG Inc. | 2,369 | 2,369 | |
| UTAS-USA Ltd. | 2,358 | 2,358 | |
| Wilson Combat | 2,095 | 253 | 2,348 |
| Adams Arms | 2,342 | 2,342 | |
| FMK Firearms Inc. | 2,316 | 2,316 | |
| Anderson Mfg. | 2,295 | 2,295 | |
| Black Rain Ordnance Inc. | 2,291 | 2,291 | |
| Alex Pro Firearms | 2,232 | 2,232 | |
| Seekins Precision | 2,227 | 2,227 | |
| James River Armory | 2,149 | 2,149 | |
| Cooper Firearms Of Montana Inc. | 1,915 | 1,915 | |
| Noveske Rifleworks | 1,696 | 1,696 | |
| V Custom Inc. | 1,667 | 1,667 | |
| JP Enterprises Inc. | 1,614 | 1,614 | |
| Good Time Outdoors Inc. | 1,575 | 1,575 | |
| Arsenal Inc. | 1,521 | 1,521 | |
| Austin Precision Products Inc. | 1,498 | 1,498 | |
| Aero Precision | 1,490 | 1,490 | |
| Fierce Firearms | 1,486 | 1,486 | |
| Magnum Research Inc. | 1,483 | 1,483 | |
| BP Firearms Co. | 1,445 | 1,445 | |
| Montana Rifle Co. | 1,396 | 1,396 | |
| Steyr Arms Inc. | 1,360 | 1,360 | |
| Lewis Machine & Tool Co. | 1,358 | 1,358 | |
| Modern Outfitters | 1,288 | 1,288 | |
| PTR Industries Inc. | 1,277 | 1,277 | |
| Pneu-Dart Inc. | 1,248 | 1,248 | |
| 2A Armament | 1,238 | 1,467 | |
| TNW Firearms Inc. | 1,197 | 1,197 | |
| Kidd Innovative Design | 1,182 | 1,182 | |
| Browning Arms Co. | 668 | 453 | 1,121 |
| Riley Defense Inc. | 1,079 | 1,079 | |
| Nosler Inc. | 1,078 | 1,078 | |
| Luxus Arms | 1,026 | 1,026 | |
| Primary Weapons Systems Inc. | 1,017 | 1,017 | |
| Xli Corp. | 1,000 | 1,000 | |
| MasterPiece Arms Co. | 991 | 991 | |
| Dark Storm Industries | 980 | 980 | |
| Fire For Effect Inc. | 977 | 977 | |
| Velocity | 957 | 957 | |
| Falkor, Sid Inc. | 942 | 1 | 943 |
| RWC Group | 839 | 839 | |
| Ithaca Gun Co. | 4 | 812 | 816 |
| Wilson Precision Arms Inc. | 813 | 813 | |
| Knights Mfg. Co | 819 | 802 | |
| Alexander Industries Inc. | 789 | 789 | |
| Ashbury Intl. Group Inc. | 788 | 788 | |
| Gunwerks | 782 | 782 | |
| F-1 Firearms | 761 | 761 | |
| G A Precision | 678 | 678 | |
| Desert Tech | 630 | 630 | |
| DoubleStar Corp. | 615 | 615 | |
| Good, William J. | 565 | 637 | |
| American Defense Mfg. | 532 | 532 | |
| Hyperion Arms And Ammo | 522 | 522 | |
| ARES Defense Systems Inc. | 514 | 514 | |
| Total | 2,504,092 | 653,139 | 3,157,231 |
Total includes all U.S. manufacturers.
| Manufacturer | Total |
| Anderson Mfg. | 211,382 |
| Palmetto State Armory | 128,529 |
| O.F. Mossberg/Maverick Arms Inc. | 115,995 |
| Aero Precision | 78,033 |
| Remington Arms Co. | 33,936 |
| Sturm, Ruger & Co. Inc. | 16,654 |
| Century Arms Inc. | 16,163 |
| Noreen Firearms | 15,005 |
| 3rd Gen Machine Inc. | 10,360 |
| New Frontier Armory | 7,070 |
| Joe Bob Outfitters | 6,375 |
| Colt’s Mfg. Co. | 6,320 |
| FosTecH Mfg. | 6,028 |
| Tennessee Arms Co. | 4,892 |
| Black Rain Ordnance Inc. | 4,699 |
| American Tactical Inc. | 4,445 |
| CMMG Inc. | 3,938 |
| SOTA Arms Inc. | 3,804 |
| Mega Arms | 3,439 |
| SMOS ARMS Inc. | 3,352 |
| F-1 Firearms | 3,308 |
| Seekins Precision | 3,136 |
| E3 Arms | 2,941 |
| Defiance Machine Inc. | 2,911 |
| Stillers Precision Firearms | 2,378 |
| Childers Guns | 2,316 |
| KE Arms | 2,282 |
| Alexandria Pro Fab Co. Inc. | 2,158 |
| Ghost Firearms | 2,132 |
| Lewis Machine & Tool Co. | 2,017 |
| Strategic Armory Corps | 2,013 |
| ZEV Technologies Inc. | 1,956 |
| Lone Wolf R&D | 1,747 |
| The Cutting Edge Precision Machining Scvs. | 1,721 |
| EDC-Tactical | 1,490 |
| Quarter Circle 10 | 1,474 |
| Dark Storm Industries | 1,455 |
| BCI Defense | 1,445 |
| Podunk Inc. | 1,160 |
| Bear Creek Arsenal | 1,145 |
| Tactical Solutions Inc. | 1,127 |
| Windham Weaponry Inc. | 1,096 |
| Tegra Arms Inc. | 1,078 |
| Smith & Wesson Corp. | 1,045 |
| Knights Mfg. Co. | 1,030 |
| Precision Machined Parts Inc. | 1,023 |
| Kelbly’s Rifle Range Inc. | 1,008 |
| Brownells Inc. | 931 |
| Zermatt Arms Inc. | 791 |
| James River Armory | 786 |
| Cross Machine Tool Co. Inc. | 774 |
| Tactical Superiority Inc. | 758 |
| Lillard Mfg. Inc. | 731 |
| Ares Defense Systems Inc. | 698 |
| Bat Machine Co. Inc. | 687 |
| Juggernaut Tactical Inc. | 622 |
| McKee Inc. | 614 |
| NoDak Spud | 610 |
| San Tan Tactical | 560 |
| Trinity Forge Inc. | 530 |
| Patriot Ordnance Factory Inc. | 522 |
| LWRC International | 517 |
| The Range Tool Co. | 471 |
| Aqua Graphix | 461 |
| Quentin Laser | 457 |
| Falkor, Sid Inc. | 441 |
| McKay Enterprises | 388 |
| LANTAC USA | 361 |
| Country Boy Enterprises Inc. | 348 |
| Tactical Innovations Inc. | 343 |
| Troy Industries Inc. | 337 |
| Matrix Aerospace Corporation | 337 |
| The Tactical Edge | 323 |
| Black Creek Precision | 320 |
| Top Notch Accessories Inc. | 308 |
| Total | 758,634 |
Total includes all U.S. misc. firearm manufacturers. Per ATF: “Examples of miscellaneous firearms include pistol grip firearms, starter guns and firearm frames and receivers.”
| MANUFACTURER | EXPORTS |
| SIG SAUER Inc. | 177,414 |
| GLOCK Inc. | 47,861 |
| Smith & Wesson Corp. | 22,440 |
| Sturm, Ruger & Co. Inc. | 10,534 |
| Beretta USA Corp. | 4,750 |
| Remington Arms Co. | 3,022 |
| Kimber Mfg. Inc. | 2,605 |
| Colt’s Mfg. Co. | 1,870 |
| Magnum Research Inc. | 1,002 |
| FN America | 636 |
| Les Baer Custom Inc. | 492 |
| Kel-Tec CNC Industries Inc. | 351 |
| Taurus International Manufacturing Inc. | 275 |
| Saeilo Inc. | 271 |
| SCCY Industries | 270 |
| FMK Firearms Inc. | 214 |
| Rainier Arms | 166 |
| Nighthawk Custom | 162 |
| Strayer Voigt Inc. | 159 |
| Springfield Inc. | 152 |
| Kriss USA Inc. | 119 |
| Wilsons Gun Shop Inc. | 111 |
| Angstadt Arms | 111 |
| Bixler, Christopher A | 95 |
| JV Industries | 63 |
| North American Arms Inc. | 58 |
| Engage Armament | 50 |
| Cabot Gun Co. | 37 |
| AmChar Wholesale Inc. | 36 |
| Meggitt Training Systems Inc. | 15 |
| V Custom Inc. | 12 |
| Worldwide Aeros Corp | 10 |
| Strategic Armory Corps | 10 |
| Pioneer Gun Works Inc. | 10 |
| Ramm. Karl Joseph | 10 |
| Ed Brown Products Inc. | 9 |
| Interfor USA Group Inc. | 8 |
| Patriot Ordnance Factory Inc. | 6 |
| Jacobs, Gregory Scott | 2 |
| Christensen Arms | 2 |
| 2A Tactical | 1 |
| DTCC Inc. | 1 |
| Lone Wolf R&D | 1 |
| Wilson Precision Arms Inc. | 1 |
| Total Exports | 275,424 |
| MANUFACTURER | EXPORTS |
| Smith & Wesson Corp. | 16,230 |
| Sturm, Ruger & Co. Inc. | 3,992 |
| North American Arms Inc. | 705 |
| Kimber Mfg. Inc. | 334 |
| Colt’s Mfg. Co. | 158 |
| Charter Arms Inc. | 122 |
| Magnum Research Inc. | 112 |
| AmChar Wholesale Inc. | 10 |
| Bixler, Christopher A. | 9 |
| JV Industries | 2 |
| Heritage Mfg. Inc. | 2 |
| Total Exports | 21,676 |
| MANUFACTURER | EXPORTS |
| Remington Arms Co. | 18,238 |
| O.F. Mossberg/Maverick Arms Inc. | 10,559 |
| Beretta USA Corp. | 667 |
| Kel-Tec CNC Industries Inc. | 514 |
| Peetz, Robert Eugene | 5 |
| Interfor USA Group Inc. | 3 |
| Bixler, Christopher A. | 3 |
| Wilson Combat | 2 |
| R & R Racing Inc. | 2 |
| JV Industries | 2 |
| Nighthawk Custom | 1 |
| Sizemore, Estel David | 1 |
| Total Exports | 29,997 |
| MANUFACTURER | EXPORTS |
| Remington Arms Co. | 62,345 |
| Sturm, Ruger & Co. Inc. | 39,551 |
| Smith & Wesson Corp. | 11,835 |
| O.F. Mossberg/Maverick Arms Inc. | 11,180 |
| Henry Rac Holding Corp. | 10,533 |
| Bear Creek Arsenal | 2,999 |
| Kel-Tec CNC Industries Inc. | 2,659 |
| Colt’s Mfg. Co. | 2,097 |
| STI Firearms | 1,959 |
| SIG SAUER Inc. | 1,758 |
| Troy Industries Inc. | 1,411 |
| KRISS USA Inc. | 1,077 |
| Just Right Carbines | 990 |
| Daniel Defense Inc. | 918 |
| Kimber Mfg. Inc. | 859 |
| Barrett Firearms Mfg. Inc. | 696 |
| TNW Firearms Inc. | 613 |
| Weatherby Inc. | 568 |
| Desert Tech | 420 |
| Strategic Armory Corps | 357 |
| Patriot Ordnance Factory Inc. | 331 |
| Christensen Arms | 331 |
| Stag Arms | 324 |
| FN America | 261 |
| Springfield Armory | 243 |
| Rainier Arms | 207 |
| Windham Weaponry Inc. | 174 |
| Anderson Mfg. | 167 |
| Pneu Dart Inc. | 167 |
| Kelbly’s Rifle Range Inc. | 155 |
| V Custom Inc. | 118 |
| Fierce Firearms | 105 |
| Lewis Machine & Tool Co. | 102 |
| Riverman | 101 |
| Wilson Precision Arms Inc. | 96 |
| Alexander Industries Inc. | 94 |
| Tippmann Arms Co. | 90 |
| Magnum Research Inc. | 84 |
| Meggitt Training Systems Inc. | 56 |
| Lancer Systems | 53 |
| Sarco Inc. | 50 |
| Defense Research & Development | 47 |
| Primary Weapons Systems Inc. | 37 |
| Nordic Components Inc. | 34 |
| F-1 Firearms | 31 |
| Jacc Procurement | 30 |
| Thureon Holdings | 29 |
| Powder River Rifle Co. Inc. | 25 |
| Montana Rifle Co. | 24 |
| Beretta USA Corp. | 24 |
| Serbu Firearms Inc. | 21 |
| Sage Creek Enterprises Inc. | 21 |
| Interfor USA Group Inc. | 21 |
| Wilson Combat | 20 |
| Davco Services | 20 |
| Skyarms | 20 |
| Saeilo Inc. | 19 |
| Gunwerks | 19 |
| PROOF Research Inc. | 18 |
| Bixler, Christopher A | 17 |
| CBE Inc. | 17 |
| McAlister, Kenneth | 15 |
| Knights Mfg. Co. | 14 |
| Noreen Firearms | 14 |
| Austin Precision Products Inc. | 14 |
| Thor Global Defense Group Inc. | 13 |
| Nosler Inc. | 13 |
| Ramm, Karl Joseph | 12 |
| Creed Monarch Inc. | 11 |
| Worldwide Aeros Corp. | 10 |
| ARES Defense Systems Inc. | 10 |
| AmChar Wholesale Inc. | 10 |
| Ohio Ordnance Works Inc. | 10 |
| Total Exports | 158,871 |
Totals include all U.S. manufacturers.
| COUNTRY | 2017 | 2018 |
| Argentina | 33,676 | 39,969 |
| Austria | 1,198,719 | 927,181 |
| Belgium | 21,453 | 25,394 |
| Brazil | 703,728 | 664,763 |
| Bulgaria | 324 | 1,293 |
| Canada | 5 | 1 |
| Columbia | 10 | |
| Croatia | 326,653 | 295,107 |
| Czech Republic | 140,576 | 180,084 |
| Denmark | 77 | |
| Finland | 3 | 174 |
| France | 519 | 261 |
| Germany | 340,821 | 327,297 |
| Hungary | 258 | 883 |
| Israel | 15,133 | 11,910 |
| Italy | 173,394 | 154,276 |
| Norway | 24 | |
| Pakistan | 400 | |
| Philippines | 87,161 | 123,470 |
| Poland | 14 | 5,426 |
| Portugal | 230 | |
| Romania | 9,911 | 23,562 |
| Russia | 17 | |
| Serbia | 16,470 | 5,575 |
| Slovakia | 2,196 | 1,996 |
| Slovenia | 6,014 | 3,232 |
| South Africa | 18 | |
| South Korea | 70 | |
| Spain | 24,129 | 18,026 |
| Sweden | 4 | 41 |
| Switzerland | 6,992 | 10,660 |
| Taiwan | 750 | |
| Turkey | 80,090 | 68,921 |
| U.K. | 300 | |
| U.K. | 7 | 111 |
| Total | 3,190,024 | 2,889,735 |
Import data is provided by the U.S Census Bureau, Economic Indicators Division.
| COUNTRY | Semi- Auto |
Semi- Auto |
Bolt | Bolt | NESOI | NESOI | Rimfire | Rimfire | Total | Total |
| 2017 | 2018 | 2017 | 2018 | 2017 | 2018 | 2017 | 2018 | 2017 | 2018 | |
| Australia | 2 | 818 | 820 | |||||||
| Austria | 2,739 | 4,302 | 180 | 137 | 80 | 71 | 28 | 3,027 | 4,510 | |
| Belgium | 21,891 | 15,975 | 17,692 | 13,614 | 680 | 62 | 5 | 40,268 | 29,651 | |
| Brazil | 19,237 | 28,196 | 80 | 110,735 | 19,317 | 138,931 | ||||
| Bulgaria | 1,816 | 3,000 | 1,816 | 3,000 | ||||||
| Canada | 1,567 | 1,666 | 2 | 200,437 | 170,510 | 202,004 | 172,178 | |||
| Czech Rep. | 8,314 | 7,938 | 15 | 11 | 18,751 | 19,928 | 27,080 | 27,877 | ||
| Denmark | 79 | 79 | ||||||||
| Finland | 35,264 | 34,771 | 4 | 7 | 1 | 35,268 | 35,268 | |||
| France | 3 | 724 | 17 | 13 | 524 | 737 | 544 | |||
| Germany | 108 | 1,885 | 4,293 | 9,019 | 188 | 203 | 4,748 | 3,227 | 9,337 | 14,334 |
| Hungary | 350 | 350 | ||||||||
| Ireland | ||||||||||
| Israel | 4,463 | 2,736 | 2 | 2,147 | 943 | 3 | 6,615 | 3,679 | ||
| Italy | 2,338 | 565 | 150 | 1,288 | 5,372 | 4,839 | 5,371 | 10,261 | 13,231 | 16,953 |
| Japan | 53,746 | 48,182 | 15,608 | 10,831 | 7,322 | 8,827 | 76,676 | 67,840 | ||
| Netherlands | 1 | 1 | 1 | 1 | ||||||
| Peru | 4 | 4 | ||||||||
| Philippines | 3,725 | 7,430 | 3,725 | 7,430 | ||||||
| Poland | 778 | 1,815 | 761 | 778 | 2,576 | |||||
| Portugal | 1,932 | 2,918 | 5,035 | 2,565 | 1,070 | 8,037 | 5,483 | |||
| Romania | 5,735 | 6,300 | 500 | 253 | 5,735 | 7,053 | ||||
| Russia | 8,430 | 8,430 | ||||||||
| Serbia | 8,324 | 70 | 19 | 8,394 | 19 | |||||
| South Africa | 10 | 2 | 2 | 10 | ||||||
| Spain | 149 | 1 | 37,708 | 56,181 | 37,857 | 56,182 | ||||
| Sweden | 188 | 42 | 109 | 33 | 297 | 75 | ||||
| Switzerland | 54 | 4 | 244 | 883 | 204 | 541 | 17 | 206 | 519 | 1,634 |
| Turkey | 160 | 170 | 1,000 | 2,020 | 1,330 | 2,020 | ||||
| Ukraine | 2,100 | 2,100 | ||||||||
| U.K. | 3 | 2,777 | 2,103 | 1,895 | 3,336 | 63 | 654 | 4,735 | 5,496 | |
| Total | 58,848 | 39,856 | 130,569 | 123,016 | 84,332 | 108,383 | 241,550 | 334,270 | 515,299 | 605,525 |
*NESOI: “Not Elsewhere Specified Or Included” — Economic Indicators Division, U.S. Bureau of Census
| COUNTRY | SEMI- AUTO |
SEMI- AUTO |
Over/ Under |
Over/ Under |
NESOI | NESOI | Total | Total | Comb– ination |
Comb– ination |
| 2017 | 2018 | 2017 | 2018 | 2017 | 2018 | 2017 | 2018 | 2017 | 2018 | |
| Australia | 2 | 2 | ||||||||
| Austria | 2 | 248 | 250 | 19 | 1,014 | |||||
| Belgium | 32 | 3,711 | 47 | 31 | 41 | 26 | 120 | 3,768 | ||
| Brazil | 9,857 | 14,285 | 26,895 | 43,812 | 36,752 | 58,097 | 70 | 2,180 | ||
| China | 7,610 | 5,921 | 25,270 | 14,337 | 32,880 | 20,258 | ||||
| Cyprus | 2 | 2 | ||||||||
| Czech Rep. | 43 | 15 | 15 | 43 | ||||||
| Finland | ||||||||||
| France | 69 | 28 | 8 | 25 | 35 | 26 | 112 | 79 | 4 | |
| Germany | 1,609 | 1,376 | 1,311 | 421 | 435 | 1,797 | 3,355 | 486 | 247 | |
| Ireland | 7 | 2 | 7 | 2 | ||||||
| Italy | 92,372 | 105,779 | 22,877 | 30,147 | 935 | 1,467 | 116,184 | 137,393 | 771 | 1,892 |
| Japan | 790 | 913 | 3 | 13 | 733 | 926 | ||||
| Pakistan | 250 | 250 | ||||||||
| Philippines | 100 | 3,000 | 3,100 | |||||||
| Portugal | 10 | 33 | 10 | 33 | ||||||
| Russia | 7,410 | 16 | 7,410 | 16 | ||||||
| Serbia | 18 | 18 | ||||||||
| Spain | 714 | 7 | 31 | 4,184 | 805 | 4,191 | 1,550 | |||
| Sweden | 91 | 27 | 91 | 27 | ||||||
| Taiwan | 47 | |||||||||
| Turkey | 97,916 | 157,937 | 71,755 | 53,892 | 67,517 | 85,552 | 237,188 | 297,381 | 710 | |
| U.K. | 1,537 | 2,945 | 968 | 912 | 2,505 | 3,857 | 342 | 3 | ||
| Total | 205,519 | 275,732 | 108,201 | 103,692 | 129,625 | 147,680 | 443,345 | 527,104 | 1,692 | 6,046 |
*NESOI: “Not Elsewhere Specified Or Included” — Economic Indicators Division, U.S. Bureau of Census
| Manufacturer | Total |
| Colt’s Mfg. Co. | 1,071 |
| Aero Precision | 406 |
| Gwacs Armory | 397 |
| Kelbly’s Rifle Range Inc. | 178 |
| Smith & Wesson Corp. | 91 |
| Sturm, Ruger & Co. Inc. | 51 |
| Windham Weaponry Inc. | 48 |
| Ideal Products Inc. | 41 |
| PROOF Research Inc. | 12 |
| Irunguns | 10 |
| Brownells Inc. | 9 |
| AmChar Wholesale Inc. | 8 |
| Patriot Ordnance Factory Inc | 6 |
| Diorio Mfg. Co. | 3 |
| Tornado Technologies | 1 |
| Total Exports | 2,332 |