Putting U.S. Census Insights To Work For You
Aug. 12, the U.S. Census Bureau released additional 2020 Census data after its initial apportionment results were published in late April. (To the delight of many, even native Californians like myself, California lost a Congressional seat for the first time, but that’s another story.) The 2020 Census results yielded some interesting insights on how the U.S. population is continuing to shift and diversify — industry organizations, manufacturers and dealers would do well to take note of while targeting grassroots participation efforts.
Population Shifts
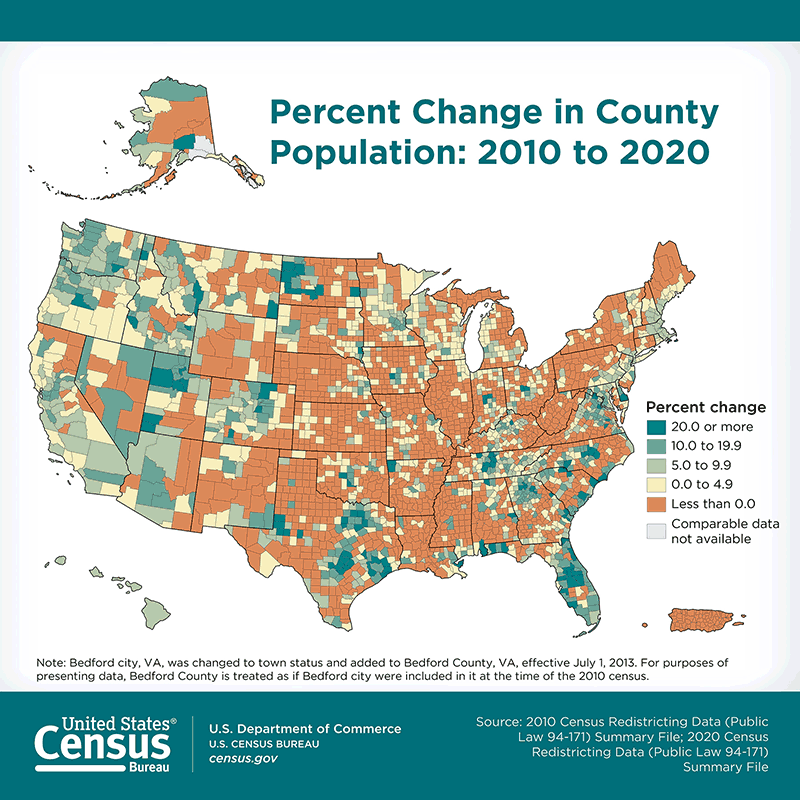
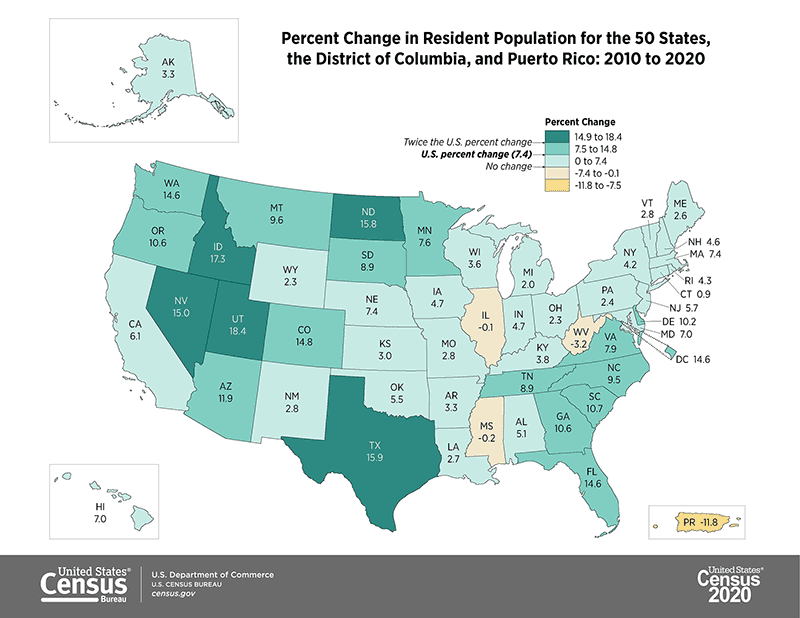
Confirming industry reports of the past few years, the U.S. population is continuing to become more urbanized and diverse. According to 2020 Census data, the population of U.S. metro areas grew by 9% from 2010 to 2020, resulting in 86% of the population living in U.S. metro areas in 2020, marginally up from 85% in 2010.
“Many counties within metro areas saw growth, especially those in the south and west,” said Marc Perry, a senior demographer at the Census Bureau. “However, as we’ve been seeing in our annual population estimates, our nation is growing slower than it used to .This decline is evident at the local level where around 52% of the counties in the United States saw their 2020 Census populations decrease from their 2010 Census populations.
Other 2020 county and metro area highlights:
• LA County remains the largest U.S. county in the U.S. (10+ million people).
• New York remains the largest U.S. city (8.8. million).
• Over 80% of U.S. metro areas (312 of 384) gained population from 2010 to 2020 .
• The Villages, Fla., was the fastest-growing U.S. metro area between the 2010 and 2020 Census — growing 39% (from about 93,000 to 130,000 people).
• 72 U.S. metro areas lost population from the 2010 Census to 2020. Pine Bluff, Ark., and Danville, Ill., experienced the largest percentage declines at -12.5% and -9.1%, respectively.
• Among the decade’s most notable fast-growing areas were counties in western North Dakota: McKenzie County and Williams County jumped 131% and 83%, respectively.
• The five counties (metro areas in parentheses) that gained at least 300,000 people during 2010–2020 were located in western or southern states: Harris County, Texas (Houston-The Woodlands-Sugar Land); Maricopa County, Ariz. (Phoenix-Mesa-Chandler); King County, Wash. (Seattle-Tacoma-Bellevue); Clark County, Nev. (Las Vegas-Henderson-Paradise); and Tarrant County, Texas (Dallas-Fort Worth-Arlington).
Growing Diversity
The 2020 Census provided a snapshot of how the U.S.’ racial and ethnic composition has changed, as well. Some highlights:
• The White population remained the largest race or ethnicity group in the U.S., with 204.3 million people identifying as White alone. Overall, 235.4 million people reported White alone or in combination with another group. However, the White alone population decreased 8.6% since 2010.
• The Two or More Races population (also referred to as the Multiracial population) has changed considerably since 2010. The Multiracial population was measured at 9 million people in 2010 and is now 33.8 million people in 2020, a 276% increase.
• All of the race alone or in combination groups experienced increases. The Some Other Race alone or in combination group (49.9 million) increased 129%, surpassing the African American population (46.9 million) as the second-largest race alone or in combination group.
• The next largest racial populations were the Asian alone or in combination group (24 million), the American Indian and Alaska Native alone or in combination group (9.7 million), and the Native Hawaiian and Other Pacific Islander alone or in combination group (1.6 million).
• The Hispanic or Latino population, which includes people of any race, was 62.1 million in 2020. The Hispanic or Latino population grew 23%, while the population that was not of Hispanic or Latino origin grew 4.3% since 2010.
What Do We Do With This?
As the saying goes, “knowledge is power.” With firearms ownership continuing to be at the forefront — especially for millions of first-time gun owners — it’s important the industry recognizes shifts in population and growing diversity. If we, as an industry, are to be successful attracting folks from non-traditional backgrounds in the long-term, we’ll have to continue meeting them where they’re at. I’ll step off my soapbox now …
For those who like data, the U.S. Census Bureau has a treasure trove of information and graphics, a couple of which were used here. Visit census.gov/newsroom/press-releases/2021/population-changes-nations-diversity.html for more info.


